What is a reinforcement steel schedule? How to read, check and 7 common mistakes when creating Shop Drawings
A Shop Drawing may be presented fully and clearly, but if the quantity or length of steel in the summary table is incorrect, the fabrication and material preparation process may still encounter problems.
For example, the drawing shows the exact location, diameter, and amount of steel of a beam. However, when synthesizing the mass, the engineer missed a similar number of beams in other locations. As a result, the statistical table may be missing dozens of steel bars even though the details on the drawing are not unusual.
This is the reason the reinforcement steel schedule is not merely a summary table of quantities, but also plays an important role in data control, machining support and material planning.
So, what information does the reinforcement schedule include? How should it be checked to minimize errors during Shop Drawing implementation?

1. What is the reinforcement statistics table?
Reinforcement statistical table is a summary table of information regarding the reinforcement steel used in a specific component, group of components, or a certain scope of the project.
Depending on the regulations of each project, the table may display the steel bar code, diameter, steel grade, fabrication shape, length, quantity, and corresponding mass.
In the construction field, the reinforcement steel fabrication schedule can also be called Bar Bending Schedule (BBS).
For reinforced concrete shop drawing work, the summary table is commonly used to:
Processing support: Determine the quantity, cutting length, and bending shape of the steel bar groups.
Volume control: Summarize the reinforcement steel volume by diameter, component, or construction scope.
Compare drawings: Check for consistency between implementation details and statistical data.
Material Requirement Planning: Provide input data for the preparation, allocation, and management of steel at the construction site.
A properly and completely prepared statistical table will help the engineering, processing and materials management departments use the same data source more clearly.
2. What information does a reinforcement steel schedule include?
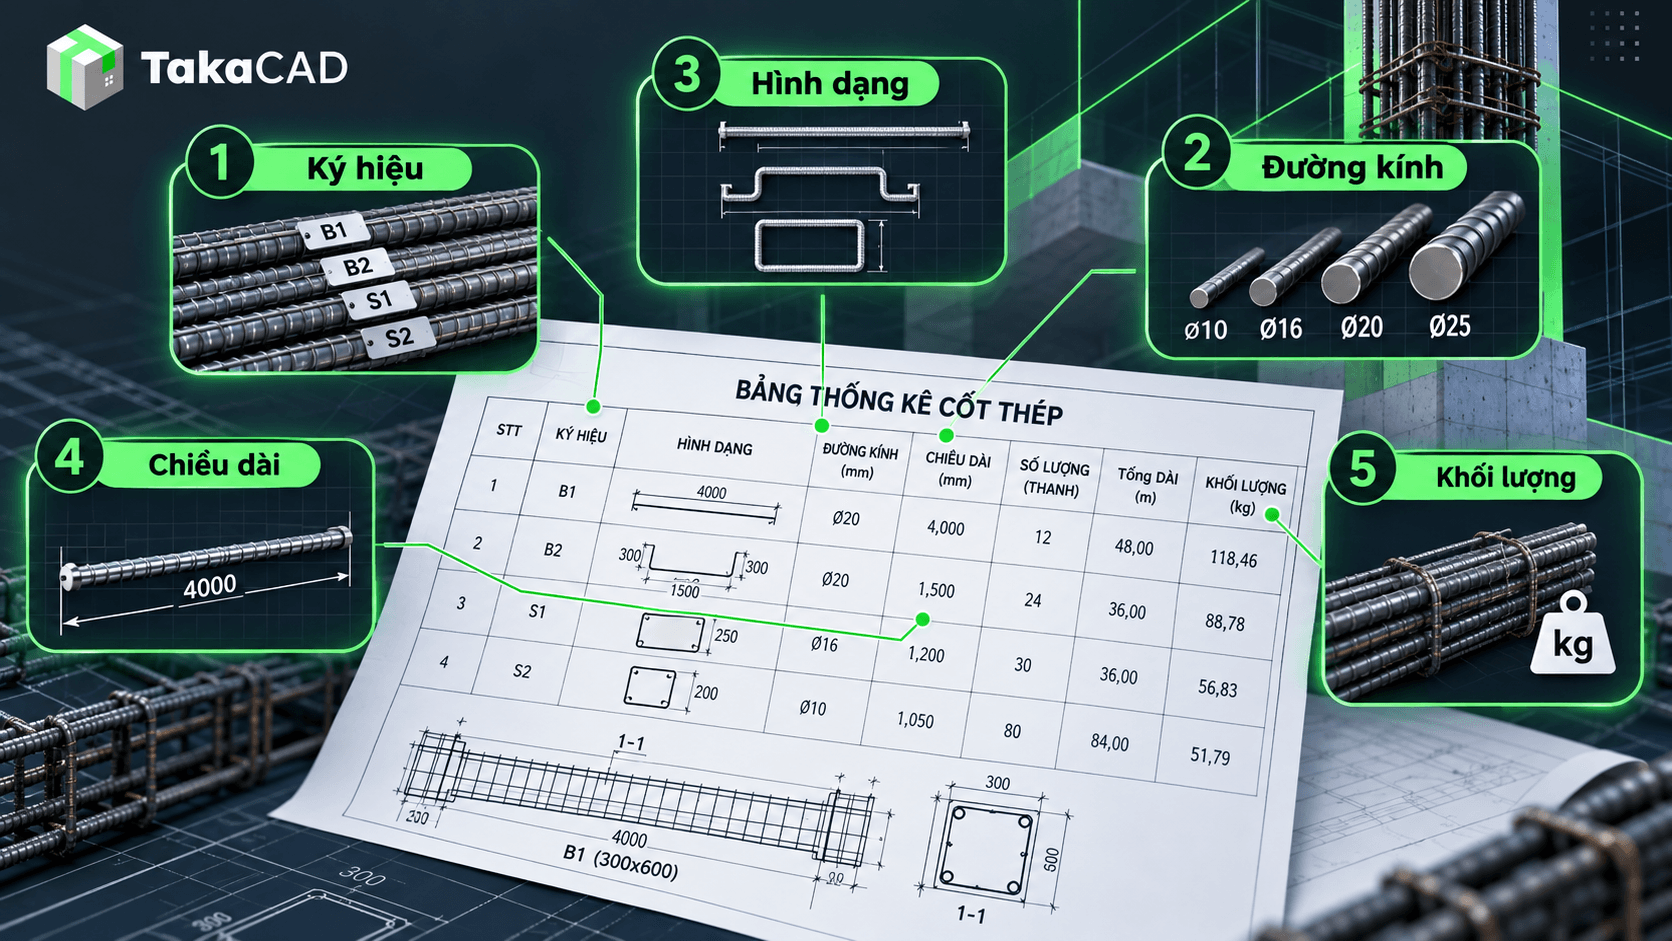
Not every project uses the same statistical table template. However, the following information typically appears in reinforcement implementation records.
| Information | Meaning |
|---|---|
| Steel bar code | Identify each group of steel on the drawing |
| Position, component | Determine whether the steel bar belongs to a beam, slab, column, wall, or foundation |
| Steel diameter | Indicate nominal size, for example Ø10, Ø16, Ø20 |
| Steel grade | Determine steel type according to design |
| Bar shape | Shows straight bars, bent bars, hooks or other types of machining |
| Cutting length | Machining length of each bar |
| Quantity | Total corresponding number of steel bars |
| Volume | The amount of steel is calculated from the length and unit weight. |
Among them, three particularly important information that needs to be compared are: machining length, number of bars, and steel weightPlease provide the text you would like me to translate.
For example, two groups of bars with the same diameter Ø16 but different lengths or bending shapes cannot be automatically considered the same type of bar for fabrication purposes.
Similarly, when a steel code is used in many members, the aggregate quantity must reflect the correct number of bars of all members within the statistical range.
Therefore, when checking the statistics table, engineers should not only look at the total volume at the bottom of the table but also need to cross-check the component information.

3. How to read and check the reinforcement statistics table
To read the statistics table effectively, engineers should start with the related drawing, then sequentially check the information from the structural components to each group of steel bars.
Step 1: Determine components and statistical scope
First, it is necessary to determine which statistical table is applicable to which structure, floor, area or construction stage.
For example, an inventory of beams on the 3rd floor does not necessarily include all the number of beams with the same code on other floors.
Clearly defining the scope helps avoid missing statistics or overlapping volumes.
At the same time, the engineer needs to check whether the drawing version being used is consistent with the approved documentation.
Step 2: Cross-check steel codes and diameters
Each group of bars in the table should be checked with the corresponding symbol on the drawing.
The information that should be cross-checked includes:
Steel bar code or position.
Diameter and steel grade.
The number of bars in each component.
Machining shape and size.
In particular, do not rely solely on diameter to group groups of bars. Bars of different shapes or lengths still need to be distinguished according to project statistical conventions.
Step 3: Check machining length
The length of the steel bar is a factor that directly affects the statistical volume and processing work.
For simple straight bars, the cutting length can be determined relatively directly from the implementation details.
However, for bars with bends, hooks, anchors or joints, determining the length must consider the corresponding structure and processing conventions.
The total outer dimension of a bent bar should not be automatically taken as the actual cutting length.
Requirements related to anchor structure and reinforcement connection need to be checked according to design documents and applicable standards of the project, for example TCVN 5574:2018 – Design of concrete and reinforced concrete structuresPlease provide the text you would like me to translate.
Step 4: Check the number of steel bars
After determining the correct size, the engineer needs to check the number of bars for each component and the entire statistical range.
For example, if a type of beam has four identical steel bars appearing at five different locations, the total quantity of that bar group is:
4 × 5 = 20 bars.
A common error is only recording the quantity of one component but forgetting to multiply by the number of identical components.
For stirrups, the inspection process can be more complex because the spacing of the stirrups may vary across different zones of the same structural component. In such cases, the quantity must be cross-checked according to each layout zone and the representation conventions on the drawings.
Step 5: Check reinforcement volume
The weight of the reinforcement steel is determined from the total length of the steel and the weight per linear meter corresponding to the steel diameter.
General formula:
Steel weight (kg) = Total steel length (m) × Unit weight (kg/m)
For deformed steel bars, the nominal mass values by diameter can be referred to at __AI_TOK_0__ TCVN 1651-2:2018 – Steel for the reinforcement of concrete, Part 2: Deformed steel barsPlease provide the text you would like me to translate.
When calculating, the units of measurement must be consistent. For example, if the length on the drawing is represented in millimeters, it must be converted to meters before multiplying by the unit weight in kg/m.
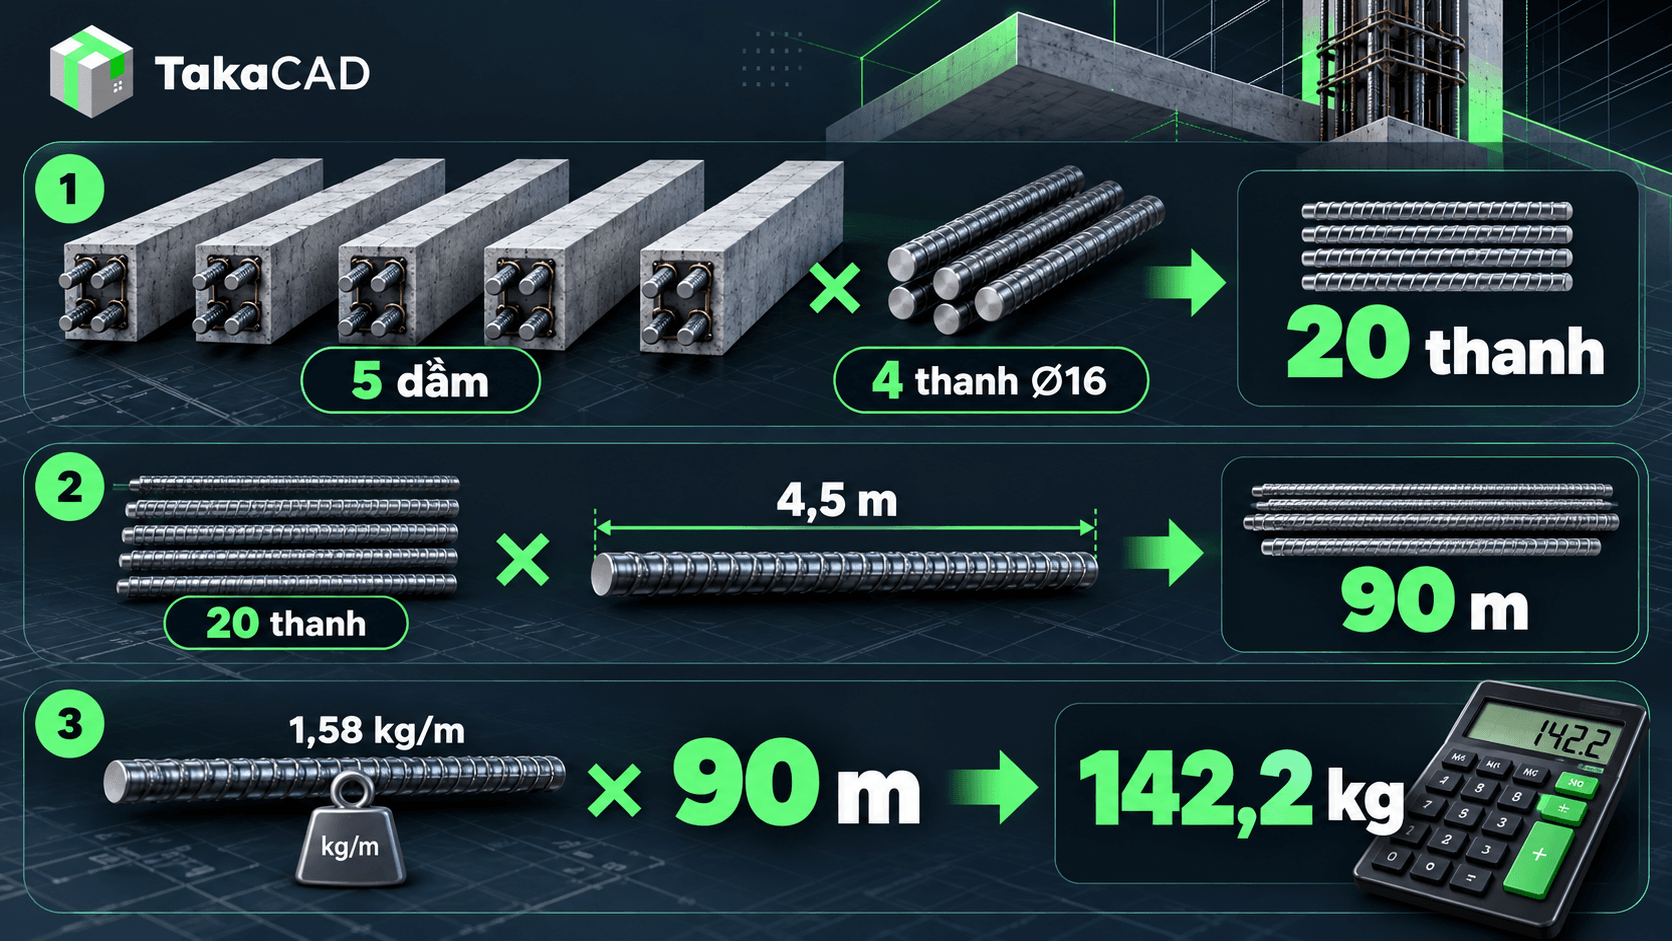
4. Example of calculating reinforcement steel volume from the statistical table
Suppose a construction area has 5 identical D1 beams. Each beam uses 4 straight Ø16 steel bars, with a cutting length of 4,500 mm per bar.
Illustrative information:
| Specifications | Value |
|---|---|
| Component | Beam D1 |
| Number of beams | 5 |
| Steel diameter | Ø16 |
| Number of bars per beam | 4 bars |
| Length of each bar | 4,500 mm = 4.5 m |
| Nominal mass Ø16 | 1.58 kg/m |
Step 1 – Calculate the total number of bars
5 beams × 4 bars/beam = 20 bars
Step 2 – Calculate total length
20 bars × 4.5 m = 90 m
Step 3 – Calculate total mass
90 m × 1.58 kg/m = 142.2 kg
Thus, the total nominal mass of the Ø16 steel bar group in the example is approximately 142.2 kgPlease provide the text you would like me to translate.
Note: This is an illustrative example for straight bars with determined cut lengths, not including losses during the cutting and processing stages or requirements for spare materials.
Notably, the statistical results do not depend solely on the mass calculation formula. If the length or the initial number of bars is entered incorrectly, the results may still be wrong even if the multiplication is perfectly accurate.

5. 7 common mistakes when creating reinforcement steel schedules
During the Shop Drawing implementation process, errors often arise because drawing data, component data, and statistics tables have not been synchronously checked.
Below are seven issues that require special attention.
5.1. Using statistics tables from old drawing versions
The structural drawings have been adjusted, but the schedules still retain the previous data.
For example, the diameter or length of steel in a beam group has changed, but the summary table has not been updated.
How to limit: Check the drawing version code and review the affected reinforcement groups after each document adjustment.
5.2. Statistics of missing or duplicate component quantities
A component can appear multiple times within the same level or in different areas.
If statistics are based on only one location while omitting others, the total volume will be deficient. Conversely, double-counting the same group of components will incorrectly increase the volume.
How to limit: Set up the component list and reconcile quantities by floor and area before aggregating.
5.3. Incorrect diameter or steel grade
Steel groups with the same length but different diameters or steel grades must be clearly distinguished.
Diameter deviation can affect machining data, calculated volume, and material requirements.
Ways to limit: Simultaneously check the symbols on the drawing, the parameters in the statistics table, and the material requirements of the project.
5.4. Incorrect determination of steel bar length
Errors may occur when determining the lengths of bars with hooks, bends, or anchor and lap configurations.
If only the geometric dimensions are taken simply without considering machining details, the statistical length may not be appropriate.
How to limit: Check the bar shape, machining dimensions, and structural requirements before finalizing the cutting length.
5.5. Calculate the error in the quantity of stirrups
In practice, a beam or column can be arranged with stirrups at different spacings for each zone.
If the same stirrup spacing is applied to the entire component, the number of bars in the statistics may be incorrect.
Ways to limit: Clearly distinguish the striping zones, check the start and end points, and determine how to handle the boundaries between zones.
5.6. Incorrect unit or unit quantity
A table using millimeters for length, while the mass calculation formula uses meters, can lead to significant discrepancies if the conversion step is missing.
Additionally, selecting the wrong unit of measurement for the steel diameter also makes the summary results inaccurate.
Ways to limit: Standardize measurement units and check the nominal quantity tables currently in use.
5.7. Confusing statistical volume with the amount of steel to be purchased
The quantities calculated from drawings may not necessarily equal the actual amount of materials needed to be ordered.
When planning materials, it is also necessary to consider the steel cutting plan, commercial steel lengths, processing waste, inventory levels, and supply conditions.
How to limit: Clearly distinguish between the quantities according to the Shop Drawing records and the quantities for procurement and material issuance planning.

6. Checklist for reviewing reinforcement schedules before issuing documents
To minimize errors, engineers can use the following checklist before finalizing the statistics table:
□ Check the correct drawing version and the statistical scope.
□ Cross-check the quantity of components by floor and area.
□ Check the code, shape, and position of the steel groups.
□ Cross-check the diameter and steel grade with the design documents.
□ Check cutting length, bending details, hooks and anchors, and splices.
□ Review the number of bars, especially in the stirrup distribution areas.
□ Check the unit of measurement, unit mass, and synthesis method.
□ Confirm that the statistics table reflects the latest changes of the drawing.
This checklist can be used during manual inspection or when cross-checking results from statistical support software.
The important thing is not only to complete all the items, but also to ensure that the data in the table is truly consistent with the drawings and technical requirements of the project.
7. How to minimize errors when calculating reinforcement statistics?
With a few simple components, manual statistics or using Excel can meet the work requirements.
However, as the number of components increases, especially in buildings with many floors and various steel groups, the coordination work can become more complex.
A statistical table with hundreds of steel bar codes requires not only accurate calculations but also good control of data sources.
To improve efficiency, engineers can apply several principles:
First, standardize the data from the beginning. Standardize the bar marks, component names, units of measurement, and statistical forms to facilitate cross-checking.
Second, manage drawing changes. When component parameters change, it is necessary to identify the affected steel groups and update the corresponding data.
Third, limit repetitive data entry. Data extraction, parsing, and synthesis tools can be used directly from drawings to reduce manual copying.
Fourth, maintain an independent verification step. Whether the statistics table is created manually or by software, the results must still be checked by an engineer before being used for machining or material management.
A good statistical process not only helps in creating tables faster but also makes it easier for engineers to retrieve, check, and adjust data when necessary.
8. Frequently Asked Questions about the reinforcement steel schedule
Are the reinforcement statistics table and the quantity takeoff table the same?
The two types of tables are related but not necessarily identical in purpose and level of detail.
The fabrication statistics table usually displays information by mark, shape, length, and quantity of bars. Meanwhile, the quantity takeoff table may summarize materials by task, component, or item to serve estimation and quantity management.
Can the steel weight be calculated using the formula d²/162?
Yes. This is an approximate formula commonly used to calculate the mass per linear meter of a steel bar with a nominal diameter d (mm):
Unit weight (kg/m) ≈ d²/162
However, when preparing official statistical tables, the nominal volume values consistent with the material standards applied to the project should be used, and rounding rules should be unified.
Is it necessary to update the statistics table when the Shop Drawing changes?
Yes. When drawings change, engineers need to review the related reinforcement groups and update the affected data.
Even if only a few components are changed, verification is still necessary to ensure the statistics table matches the current drawing version.

9. Conclusion
The reinforcement schedule is an important part of the Shop Drawing documentation, connecting drawing deployment data with fabrication work and material management.
To ensure statistical quality, engineers need to pay attention to the consistency between bar marks, shapes, lengths, quantities, and steel weights. In particular, whenever the drawings change, the statistical data must also be checked and updated accordingly.
An accurate statistics table not only helps control the volume but also contributes to limiting errors arising in subsequent stages.
TakaCAD – Supporting more convenient reinforcement deployment and statistics
For sets of documents with many components, manually calculating, cross-checking, and updating data can take up a significant amount of the Shop Drawing engineer's time.
TakaCAD is software that supports the implementation of reinforcement Shop Drawings on AutoCAD and VinaCAD platforms, featuring tools for the implementation of beams, slabs, columns/walls, foundations, and related tasks.
In particular, TakaCAD supports drawing scanning to extract reinforcement, summarize quantities, volumes, and bar shapes, helping to reduce manual aggregation and supporting engineers in the record control process.
To learn how to apply software to the actual Shop Drawing process, you can:
Explore TakaCAD and experience the software here
Or refer to TakaCAD user guide videos to learn more details about each feature group.